Insights
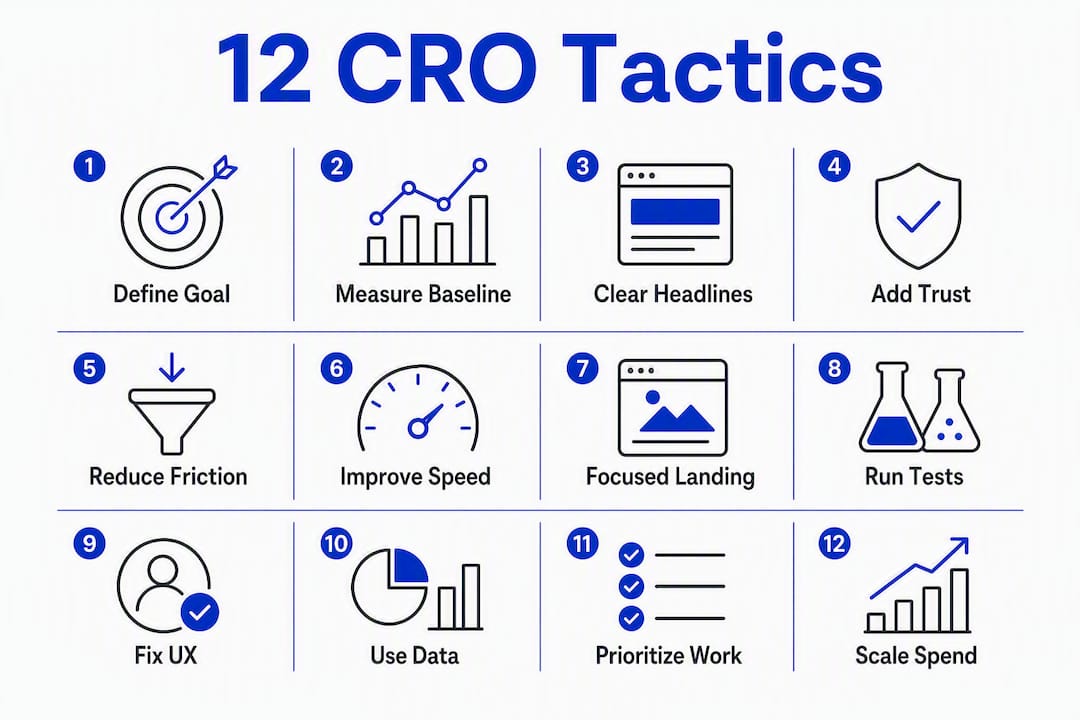
Increase Website Conversions: 12 High-Impact CRO Tactics

The fastest way to increase website conversions is to fix what’s already broken before spending another dollar on traffic. Specifically: clarify your above-the-fold value proposition, reduce friction in your primary funnels, add targeted social proof, sharpen your CTAs, speed up page load times, shorten your forms, and run prioritized A/B tests on your highest-traffic drop-off points. That sequence matters. Many sites convert at a relatively low rate, meaning a significant share of visitors leave without acting. The gap between 1% and 3% is not a creative problem. It’s a measurement and prioritization problem.
Here’s where to focus first:
- Clarify the above-the-fold value proposition so visitors understand what you offer within five seconds
- Place a primary CTA above the fold on every key landing page and product page
- Add social proof (reviews, testimonials, trust badges) near decision points
- Shorten forms to the minimum fields required to qualify a lead
- Compress large images and fix broken links for immediate speed and usability gains
- Run your first A/B test on the highest-traffic page with the worst drop-off rate
- Segment your analytics by device, channel, and landing page before drawing conclusions
- Set a conversion rate target of roughly 3%–4% before scaling paid ad spend
Google Analytics 4 (GA4) or server-side tracking gives you the baseline data to validate every change. Quantum3 helps teams move from raw data to prioritized implementation without losing weeks to setup.
Table of Contents
- How to define your conversion goal and measure your baseline
- Quick wins you can ship this afternoon
- How to run A/B tests that produce trustworthy results
- UX fixes for forms, checkout, and CTAs that reduce abandonment
- Using credibility signals to remove objections and raise conversions
- Why the first five seconds determine your conversion rate
- Which tools and metrics should you track for CRO?
- How to prioritize CRO work and know when to scale ad spend
- Quantum3’s proven process for raising conversion rates
- Key Takeaways
- The CRO mindset most teams get wrong
- Quantum3 builds the conversion infrastructure your site needs
- Authoritative resources and further reading
How to define your conversion goal and measure your baseline
Conversion rate optimization (CRO) only works when you know exactly what you’re measuring. Before touching a single headline or button color, define your primary conversion goal for each funnel stage.
Primary vs. secondary conversions by stage:
- Homepage: Primary goal is moving visitors to a product, service, or landing page. Secondary goal is email capture.
- Landing page: Primary goal is form submission or purchase. Secondary goal is scroll depth or video play.
- Product page: Primary goal is add-to-cart or request a quote. Secondary goal is wishlist or share.
- Checkout: Primary goal is completed transaction. Secondary goal is account creation.
- Content page: Primary goal is lead magnet download or newsletter signup.
The formula is straightforward: Conversion Rate = (Conversions ÷ Visitors) × 100. The table below shows how that plays out across three funnel stages.
| Funnel Stage | Monthly Visitors | Conversions | Conversion Rate |
|---|---|---|---|
| Landing page | 4,200 | — | 3%–4% |
| Product page | — | — | 3%–4% |
That checkout rate looks high, but it only reflects visitors who reached checkout, not the full funnel. That distinction is exactly why segmentation matters. A site-wide conversion rate of 2% can hide a landing page converting well above average and a checkout converting far below. Without segmentation, you optimize the wrong thing.
Capture your baseline across four dimensions: device type (mobile vs. desktop behavior diverges sharply), traffic channel (organic, paid, email, direct), new vs. returning visitors, and landing page. Each segment can tell a different story, and measuring baseline performance before making changes is what separates valid experiments from guesswork.
For deeper funnel visibility, server-side tracking gives you more accurate data than client-side scripts alone, especially as browser privacy restrictions tighten.
Pro Tip: Before running any A/B test, calculate whether your traffic volume supports it. A page receiving fewer than 500 visitors per month per variation will take months to reach statistical significance. Use a sample-size calculator (Google’s free one works) and input your current conversion rate plus the minimum detectable effect you care about. If the math doesn’t work, fix the page with qualitative methods first.
Quick wins you can ship this afternoon
Speed matters here. These are changes with a high probability of lifting conversions and a low cost of implementation. Most require no formal testing to justify.
Headline and value proposition clarity

Visitors must understand what you offer, who it’s for, and why it matters within the first five seconds of landing. That’s the blink test. If your headline says “We help businesses grow,” you’ve already lost. Replace it with something specific: “Custom landing pages that convert leads in 48 hours” tells the visitor exactly what they get and how fast.
Align your headline with the ad or search query that brought the visitor. A paid ad promising “free website audit” that lands on a generic homepage creates a mismatch that kills conversions immediately.
CTA placement and phrasing
- Move your primary CTA above the fold on every key page
- Use first-person verb framing: “Get my free audit” outperforms “Submit” or “Learn more”
- Add microcopy beneath the button to reduce hesitation: “No credit card required” or “Takes 2 minutes”
- On long pages, repeat the CTA every 400–600 words so visitors never have to scroll back up
Trust signals
Place testimonials, star ratings, and security badges near your primary CTA and at the top of checkout. A review from a named client in a recognizable industry carries more weight than a generic five-star rating. Product demo videos placed near the CTA can also reduce uncertainty for higher-consideration purchases.

Form friction
Remove every field that doesn’t directly qualify the lead. If you’re capturing a name, email, and phone number for a newsletter, you only need the email. For a sales inquiry, name, email, and company size may be sufficient. Inline validation (showing errors as users type, not after submission) reduces abandonment significantly. For e-commerce, guest checkout is non-optional: forcing account creation before purchase is one of the most documented sources of checkout abandonment.
Technical quick wins
Compressing oversized images and fixing broken links often produce measurable lifts faster than any creative redesign. Run your site through Google PageSpeed Insights right now. If your Largest Contentful Paint (LCP) is above 2.5 seconds, image compression and lazy loading for below-the-fold assets are your first technical priorities. These require no A/B test. Deploy them immediately.
Focused landing pages with a single offer and no competing navigation consistently convert above site averages. If you’re running paid traffic to your homepage, that’s a fixable problem.
Pro Tip: Low-risk UX changes (fixing broken links, adding trust badges, correcting form validation errors) don’t need A/B test coverage. They’re objectively broken. Fix them first, then use your testing capacity on changes where the right answer is genuinely uncertain.
How to run A/B tests that produce trustworthy results
A/B testing is where CRO programs either build momentum or stall. The difference is almost always process discipline, not creativity.
The test workflow:
- Define a hypothesis with a specific prediction: “Changing the CTA from ‘Submit’ to ‘Get my free report’ will increase form submissions by at least 10% because it communicates value rather than action.”
- Identify the primary metric you’re measuring (form submission rate, add-to-cart rate, checkout completion) and one secondary metric to watch for unintended effects.
- Calculate required sample size before launching. Input your current conversion rate and the minimum lift you’d consider meaningful. Run the test until you hit that sample size, not until you see a result you like.
- Set a minimum test duration of at least two full business cycles (typically two weeks) to account for weekday/weekend behavioral differences.
- Analyze for statistical significance at 95% confidence before declaring a winner. A result at 80% confidence is not a winner; it’s a coin flip with extra steps.
- Document everything, including losing variations. The hypothesis, the result, the sample size, and the confidence level all go into a shared test log.
- Iterate. A winning result becomes the new control. A losing result informs the next hypothesis.
Choosing what to test first: the PIE framework
Score each test idea on three dimensions, each rated 1–10:
- Potential: How much could this improve conversion if it works?
- Importance: How much traffic does this page or element receive?
- Ease: How much development effort does this require?
Average the three scores. Test the highest-scoring ideas first. This keeps your testing roadmap focused on revenue-relevant pages rather than low-traffic edge cases.
When to test vs. when to just fix
If a page has fewer than 500 monthly visitors per variation, qualitative methods (session recordings, heatmaps, user interviews) will give you faster, cheaper answers than a formal A/B test. CRO is a repeatable loop: measure, hypothesize, test, iterate. The loop works at any traffic level, but the tools change.
Only a minority of experiments produce statistically significant winners. That’s expected. A disciplined program treats every result as a learning asset, not a pass/fail grade.
Pro Tip: A losing test is often more valuable than a winner. If you hypothesized that a shorter headline would lift conversions and it didn’t, you’ve learned something specific about what your audience responds to. Log the result, update your mental model, and let it shape the next three hypotheses. Teams that discard losing results repeat the same mistakes.
UX fixes for forms, checkout, and CTAs that reduce abandonment
Forms and checkout flows are where conversion intent meets execution friction. Most of the friction is self-inflicted.
Form best practices:
- Start with the easiest field (usually first name or email) to build momentum before asking for more sensitive information.
- Use single-column layouts. Multi-column forms increase cognitive load and error rates.
- Label fields above the input, not inside it. Placeholder text disappears when the user starts typing.
- Show inline validation in real time. Don’t wait until submission to surface errors.
- For longer forms, use progressive profiling: capture the minimum on the first interaction, then gather additional data over subsequent visits or touchpoints.
- Remove optional fields entirely, or clearly mark them as optional so users don’t feel obligated.
Checkout-specific fixes:
- Offer guest checkout as the default path, with account creation as an optional post-purchase step
- Display accepted payment methods and security badges (SSL, payment processor logos) visibly before the user reaches the payment field
- Implement address auto-complete to reduce typing friction on mobile
- Show a persistent order summary throughout checkout so users don’t navigate away to verify their cart
- For e-commerce, abandoned cart recovery emails are one of the highest-ROI tactics available. Set them up before you run a single A/B test on checkout design.
CTA guidance for long pages:
- Use a strong verb that communicates the specific outcome: “Book a free strategy call,” not “Contact us.”
- Keep commitment language low: “No contract, cancel anytime” reduces perceived risk.
- Place CTAs at natural decision points: after a key benefit section, after testimonials, and at the end of the page.
- Test button color for contrast against your background, not for psychological symbolism. The highest-contrast option typically wins.
30-minute form and checkout audit checklist:
- Count the number of form fields. Can any be removed?
- Test the form on a real mobile device. Do labels disappear? Are tap targets large enough?
- Submit the form with intentional errors. Does inline validation fire correctly?
- Walk through checkout as a guest. Is guest checkout available?
- Check that payment badges are visible before the payment step.
- Verify that the cart persists if a user navigates away and returns.
For platform-specific guidance on ecommerce conversion optimization, the implementation details vary by platform but the principles above apply universally.
Using credibility signals to remove objections and raise conversions
Trust is a conversion lever that most sites underuse. Visitors arrive with skepticism, and every unaddressed objection is a reason to leave.
Trust signals that work and where to place them:
- Customer reviews with names and photos near the primary CTA on landing pages and product pages
- Case study snippets (a one-sentence outcome with a client name) on service pages and pricing pages
- Review platform scores (star ratings from recognized platforms) in the page header or hero section
- Media mentions and logos (“As seen in…”) below the hero section for brand credibility
- Security and payment badges at checkout entry and near the payment field
- User counts or activity signals (“Join 4,200 businesses already using…”) for SaaS and subscription products
Placement matters as much as presence. A testimonial buried in the footer does almost nothing. The same testimonial placed directly above a form submission button addresses the objection at the exact moment the visitor is deciding.
For B2B pages, persona-matched testimonials outperform generic ones. A marketing director considering a CRO service responds more to a testimonial from another marketing director than from an anonymous “business owner.” Segment your social proof by audience type and test placement by page intent.
For B2C pages, volume signals (review counts, purchase counts) carry more weight than individual testimonials. Trustpilot data consistently shows that review quantity and recency both influence purchase decisions, not just average star rating.
Test ideas for social proof:
- Swap a generic testimonial for one that directly addresses the most common objection on that page
- Add a “recent activity” widget (“12 people viewed this in the last hour”) on high-intent product pages
- Test a short video testimonial against a text testimonial in the same position
Pro Tip: For B2B service pages, a one-sentence case study outcome (“Reduced lead response time by 60% in the first month”) placed above the CTA often outperforms a full testimonial paragraph. Specificity signals credibility faster than length.
Why the first five seconds determine your conversion rate
If visitors don’t grasp what you offer within the first five seconds, bounce rates climb and conversions fall. That’s the blink test, and it applies to every page that receives cold traffic.
Technical performance checklist:
- Measure your Largest Contentful Paint (LCP) using Google PageSpeed Insights. Target under 2.5 seconds.
- Compress all hero and above-the-fold images using a tool like Squoosh or ImageOptim before uploading.
- Defer non-critical JavaScript so it doesn’t block the initial render.
- Enable server-side or edge caching for static assets.
- Remove render-blocking resources from the critical path.
- Implement lazy loading for images and videos below the fold.
Mobile-specific UX fixes:
- Tap targets (buttons, links) should be at least 44×44 pixels to prevent mis-taps
- Form fields need adequate spacing so users don’t accidentally activate the wrong input
- Simplify navigation to a hamburger menu or a single sticky CTA bar on mobile
- Use a one-column checkout flow; multi-column layouts break on small screens
Manual mobile testing protocol:
- Load your site on a real device (not just a browser emulator) on a 4G connection
- Time how long it takes for the hero content to appear
- Attempt to complete a form submission or purchase without pinching or zooming
- Check that all CTAs are tappable without zooming in
Pew Research Center data shows that a significant share of Americans use their phones as the primary shopping device, making mobile performance a direct revenue variable, not a secondary concern.
A website maintenance plan that includes monthly performance audits keeps these metrics from degrading silently after new content or features are added.
Which tools and metrics should you track for CRO?
A CRO program without the right instrumentation is operating blind. These are the tools and metrics that matter.
Analytics and attribution:
- GA4 for funnel analysis, goal tracking, and audience segmentation. Set up conversion events for every primary goal before running tests.
- Server-side tracking for more accurate attribution, especially on paid channels where browser-based tracking loses data to ad blockers and iOS privacy changes. See Quantum3’s guide to server-side tracking setup for implementation details.
- Google Analytics alternatives like Plausible or Fathom for privacy-compliant tracking when your audience is privacy-sensitive.
Behavioral tools:
- Heatmaps (Hotjar, Microsoft Clarity) to see where users click, tap, and scroll
- Session recordings to watch real user behavior and identify friction points that analytics alone won’t surface
- On-site feedback widgets (short exit-intent surveys) to capture qualitative objections directly
Experimentation platforms:
- Google Optimize has been deprecated; current options include VWO, Optimizely, and Convert for server-side and client-side testing
- For lower-traffic sites, many CMS platforms (Webflow, WordPress with plugins) offer basic A/B testing without a dedicated platform
Key metrics to track by funnel stage:
- Conversion rate per page and per funnel stage
- Drop-off rate at each step (where users exit the funnel)
- Average order value (AOV) and customer lifetime value (LTV) for e-commerce
- Cost per acquisition (CPA) by channel
- Test-specific metrics: uplift percentage, p-value, and confidence interval for every running experiment
AI-assisted analysis tools can surface patterns in large data sets faster than manual review, but human judgment is still required to form testable hypotheses and prioritize what to act on. Use AI to accelerate pattern discovery, not to replace the thinking.
Build a simple CRO dashboard in GA4 or a BI tool like Looker Studio with four views: current conversion rate by page, weekly trend, drop-off by funnel stage, and active test status. Set an alert for any conversion rate drop of more than 15% week-over-week so regressions get caught before they compound.
How to prioritize CRO work and know when to scale ad spend
Not all CRO ideas are equal, and not all traffic is ready to be scaled. Getting the sequence right is where most teams leave money on the table.
Priority scoring matrix:
- List every test idea or fix in a shared backlog.
- Score each on Traffic Affected (1–10), Severity of Problem (1–10), and Ease of Implementation (1–10).
- Average the three scores. Work top-down.
- Review and re-score the backlog monthly as new data comes in.
This is a simplified version of the PIE framework described in the testing section, applied at the program level rather than the individual test level.
When to scale paid traffic:
Scaling paid traffic before your site is optimized wastes ad spend. If your site converts at 1%, doubling your ad budget doubles your cost per acquisition without improving your return. Growth marketing practitioners consistently recommend reaching roughly a 3%–4% conversion rate before committing to major paid traffic investment. At that level, the economics of paid acquisition become predictable enough to model and scale.
Operational cadence:
- Run at least one active test at all times on your highest-traffic funnel.
- Review test results and update the backlog every two weeks.
- Document every completed test (winner, loser, or inconclusive) in a shared log accessible to the whole team.
- Keep a minimum of five prioritized hypotheses ready to launch so there’s no gap between tests.
- Revisit your baseline metrics quarterly. Conversion rates drift as traffic mix, seasonality, and product offerings change.
Pro Tip: To estimate the revenue impact of a conversion rate improvement before you test it, use this formula: (New CR ÷ Current CR − 1) × Current Monthly Revenue. If you convert at 2% and generate $50,000/month, lifting to 3% would produce roughly $75,000/month, all else equal. That estimate gives leadership a concrete reason to protect the testing roadmap.
Quantum3’s proven process for raising conversion rates
Quantum3 works with B2B service businesses, SMBs, and marketing teams that have real traffic but underperforming funnels. The process is structured, measurable, and built around compounding gains rather than one-off fixes.
The Quantum3 CRO engagement process:
- Discovery and audit: Map the existing funnel, identify the highest-traffic drop-off points, and document the current baseline (conversion rate by page, device, and channel).
- Measurement setup: Implement GA4 event tracking, server-side tracking where needed, and behavioral tools (heatmaps, session recordings) to capture the data required for valid experiments.
- Prioritized test roadmap: Score the backlog using the PIE framework and build a 90-day testing calendar with at least one active test per sprint.
- Implementation: Build and deploy test variations, landing pages, and funnel improvements. Quantum3’s development team handles the technical execution so marketing teams can focus on strategy.
- Monitoring and iteration: Track results against the baseline, document every test outcome, and update the roadmap based on learnings. Regressions get caught early through automated alerts.
Who benefits most from a structured engagement:
- B2B service businesses with lead-generation funnels that aren’t converting qualified traffic
- E-commerce brands with checkout abandonment above 70%
- Marketing teams running paid traffic to pages that haven’t been optimized for conversion
- Startups that need a high-converting website built correctly from the start, not retrofitted later
Project-based engagements work well for defined deliverables (a new landing page, a checkout rebuild, a tracking implementation). Retainer models suit teams that want a continuous testing cadence and ongoing implementation support without building an in-house CRO function.
To discuss your funnel and get a prioritized recommendation, submit an inquiry and a Quantum3 strategist will follow up within one business day.
Key Takeaways
The single most effective way to raise your conversion rate is to fix the highest-friction points in your existing funnel before spending more on traffic.
| Point | Details |
|---|---|
| Measure before you change | Calculate conversion rate by funnel stage and segment by device, channel, and landing page before making any changes. |
| Fix the blink test first | Visitors must understand your offer within five seconds; a clear above-the-fold headline and CTA is the highest-leverage single change. |
| Scale traffic at 3%–4% | Paid ad spend performs efficiently only after your site reaches a certain moderate conversion rate; scaling earlier wastes budget. |
| Run tests with discipline | Use the PIE framework to prioritize, calculate sample size before launching, and document every result including losing variations. |
| Quantum3 accelerates implementation | Quantum3 provides end-to-end CRO support: funnel audits, tracking setup, test execution, and landing page builds for B2B and SMB teams. |
The CRO mindset most teams get wrong
The most common failure mode in conversion rate optimization isn’t a bad hypothesis or a poorly designed test. It’s treating CRO as a project with an end date.
Teams run a few tests, get one or two wins, and then the roadmap quietly dies when the next product launch or campaign takes priority. Six months later, the conversion rate has drifted back down, and nobody noticed because the alerts were never set up. That pattern repeats in organizations of every size.
What actually works is treating CRO as an ongoing measurement and learning program with the same operational status as paid media or content. That means a maintained test backlog, a regular cadence for reviewing results, and leadership that celebrates a well-designed losing test as much as a winner. A losing test that rules out a bad hypothesis is worth more than a winning test nobody learns from.
The other pitfall is insufficient instrumentation. Teams often start testing before they have clean baseline data, which means they can’t tell whether a result is real or an artifact of tracking gaps. Setting up proper measurement first feels slow. It isn’t. It’s the difference between a CRO program that compounds and one that produces noise.
One pattern worth noting: disciplined testing sometimes changes product direction entirely. A team running checkout tests discovers that the real drop-off isn’t at payment, it’s at the pricing page, because the value proposition isn’t clear enough to justify the price. That’s not a CRO finding. That’s a product and positioning finding that only surfaced because the team was measuring carefully. That’s the actual value of a well-run program.
Quantum3 builds the conversion infrastructure your site needs
Most websites leave conversion gains sitting in the funnel because the technical foundation isn’t built for it. Tracking is incomplete, landing pages are generic, and there’s no structured process for turning visitor data into tested improvements.
Quantum3 closes that gap with a practical, delivery-focused approach: high-converting landing pages and funnel builds, GA4 and server-side analytics setup, and AI integrations that capture and qualify leads automatically, including AI voice agents that handle inbound inquiries around the clock. Every engagement includes real-time analytics dashboards so you can see conversion performance without waiting for a monthly report.
Projects move fast. Quantum3 delivers with transparent pricing and no drawn-out agency timelines. Whether you need a single high-converting landing page, a full funnel rebuild, or an AI-powered lead capture system, the process starts with a clear audit of where your funnel is losing visitors right now.
Request a discovery call and get a prioritized recommendation for your site within one business day.
Authoritative resources and further reading
Measurement and analytics:
- Google PageSpeed Insights for LCP, FID, and CLS diagnostics (complements the speed and mobile section above)
- VWO’s CRO tips library for a practitioner-level reference on test design and prioritization
- Quantum3’s guide to server-side tracking for accurate attribution setup
Experimentation and CRO methodology:
- CRO fundamentals at CROforce for the measure-hypothesize-test-iterate framework and baseline benchmarks
- HubSpot’s CRO strategy guide for landing page conversion benchmarks and AI-assisted analysis approaches
- Quantum3’s guide to user journey mapping for structuring funnel analysis before testing
Performance and mobile testing:
- Shopify’s CRO guide for e-commerce-specific checkout and recovery tactics
- Pew Research Center on mobile shopping behavior for context on why mobile performance directly affects revenue
- Quantum3’s website maintenance plan guide for keeping performance metrics stable after launch
Recommended
Want this for your business?
Tell us what you have in mind. A quick conversation is all it takes to scope it out.