Insights
Core Web Vitals: Quick Wins and Priority Fixes

Core Web Vitals are three field-measured user experience signals — Largest Contentful Paint (LCP), Interaction to Next Paint (INP), and Cumulative Layout Shift (CLS) — that Google uses directly in its ranking systems. If your site scores poorly on them, you are losing both search visibility and conversions at the same time. The first thing to do right now: open Google Search Console, navigate to Experience > Core Web Vitals, and identify which URL groups are failing and on which metric.
Your fix order should follow this priority:
- Fix infrastructure and TTFB first. Slow server response time drags every other metric down. A CDN with strong UK edge presence and proper cache headers can move a site from “Needs improvement” to “Good” faster than any code refactor.
- Fix LCP second. It is the metric most directly tied to perceived load speed and the one Google weighs most heavily in practice.
- Fix INP third. Break up long JavaScript tasks and audit event handler costs across common user flows.
- Fix CLS last. It is usually the quickest to resolve once you know the cause.
Key Takeaways
Fixing Core Web Vitals starts with infrastructure and LCP — get those right first, and INP and CLS become far more manageable problems.
| Point | Details |
|---|---|
| Official thresholds | LCP ≤ 2.5s, INP ≤ 200ms, CLS ≤ 0.1 — all measured at the 75th percentile over 28 days. |
| Fix order by impact | Address TTFB and LCP first, then INP via JS task-splitting, then CLS via dimension reservations. |
| Field vs. lab data | Search Console and CrUX determine your ranking status; Lighthouse and DevTools are for debugging only. |
| Verification timeline | RUM gives immediate feedback; CrUX and Search Console reflect changes over 2–4 weeks. |
| Quantum3 audits | Quantum3 delivers prioritized sprint tickets, RUM setup, and UK hosting guidance to move sites to “Good.” |
Table of Contents
- What are the core web vitals metrics and thresholds?
- How are core web vitals measured: field vs. lab data?
- How to find failing pages in Search Console and PageSpeed Insights
- How to diagnose and fix LCP, INP, and CLS
- A prioritized checklist you can act on today
- Where to focus for the biggest business impact
- Essential tools and resources for measuring and monitoring
- What actually moves the needle on Core Web Vitals
- Quantum3 can audit and fix your Core Web Vitals
- Sources
What are the core web vitals metrics and thresholds?
Core Web Vitals are three specific, field-measured performance metrics that represent distinct dimensions of user experience: loading, responsiveness, and visual stability.
Largest Contentful Paint (LCP) measures how long it takes for the largest visible content element — typically a hero image or headline — to render in the viewport. It is the most direct proxy for perceived load speed.
Interaction to Next Paint (INP) measures the latency of all user interactions across the full page lifecycle, from click or keypress to the next visual update. INP replaced First Input Delay (FID) as the responsiveness metric because FID only captured the very first interaction, missing everything that happens after. A good INP is 200ms or less, which means the browser must paint a response within that window for every tap, click, and keystroke.
Cumulative Layout Shift (CLS) measures unexpected visual movement during the page lifecycle. A score of 0.1 or below is “Good.” Anything above 0.25 is “Poor.” It is the metric most often caused by missing image dimensions or late-loading fonts pushing content around.
Official thresholds and the 75th-percentile rule
That 75th-percentile rule is deliberate: it targets the experience of users in worse conditions, not the median.
| Metric | Good | Needs Improvement | Poor |
|---|---|---|---|
| LCP | ≤ 2.5s | 2.5s – 3.0s | > 3.0s |
| INP | ≤ 200ms | 200ms – 500ms | > 500ms |
| CLS | ≤ 0.1 | 0.1 – 0.25 | > 0.25 |
Google computes a page’s status using field data collected over a rolling 28-day window. URL groups in Search Console are assigned the status of their worst-performing metric, so a page with excellent LCP but poor CLS is still labeled “Poor.” That grouping logic is worth understanding before you start triaging, because it tells you exactly which metric to fix first for each group.
How are core web vitals measured: field vs. lab data?
The distinction between field data and lab data is one of the most misunderstood aspects of performance work, and getting it wrong leads to fixing the wrong things.
Field data comes from real users. Google’s tools use the Chrome User Experience Report (CrUX), which aggregates anonymized performance data from Chrome users who have opted in to usage statistics. CrUX powers Search Console’s Core Web Vitals report and the field section of PageSpeed Insights. This is the data Google uses for ranking. It reflects actual network conditions, devices, and user behavior on your site.
Lab data is simulated. Lighthouse and Chrome DevTools run a page in a controlled environment with a fixed network throttle and device profile. Lab data is excellent for debugging and reproducing issues, but it does not directly determine your Search Console status.
The essential measurement tools
- Google Search Console Core Web Vitals report: site-level field data, segmented by device (mobile/desktop) and URL group. Start here for triage.
- PageSpeed Insights: combines CrUX field data with a Lighthouse lab run for a single URL. Use it to diagnose specific failing pages.
- Lighthouse: lab-only audits with detailed diagnostics, opportunity estimates, and filmstrip views. Run it in Chrome DevTools or via CLI.
- Chrome DevTools: Performance panel for recording and analyzing runtime behavior, long tasks, and layout shifts frame by frame.
- CrUX: the underlying dataset, queryable via the CrUX API or BigQuery for origin- and device-segmented analysis at scale.
- web-vitals JavaScript library: a lightweight library for Real User Monitoring (RUM) that matches Google’s exact metric definitions, so your internal dashboards align with what Search Console reports.
Pro Tip: Don’t wait 28 days to validate a fix. Deploy the web-vitals JS library to send metric data to your analytics endpoint the moment users interact with the page. You will see the impact of a change within hours, not weeks, and can roll back quickly if something regresses.
How to find failing pages in Search Console and PageSpeed Insights
Step-by-step: Search Console triage
- Open Search Console and select your property.
- Navigate to Experience > Core Web Vitals.
- Choose the Mobile report first — Google indexes mobile-first, so mobile scores are what matter for ranking.
- Click Open Report to see URL groups labeled Good, Needs Improvement, or Poor.
- Click a “Poor” group to see which metric is failing and which example URLs belong to it.
- Note: URL groups with insufficient CrUX data will not appear. For low-traffic pages, Search Console falls back to origin-level data, so you may need PageSpeed Insights or CrUX API for individual URL analysis.
Diagnosing a failing URL with PageSpeed Insights
Once you have a failing URL from Search Console, paste it into PageSpeed Insights. Read the report in this order:
- Field Data section first: confirm the metric values match what Search Console shows. If they do not, you may be looking at a different URL variant (trailing slash, HTTP vs HTTPS, www vs non-www).
- Diagnostics section: look for the LCP element identified by name (e.g., “IMG element: /hero.jpg”). This tells you exactly what to optimize.
- Opportunities: Lighthouse-generated suggestions with estimated savings in milliseconds.
Triage checklist
- Is TTFB above 600ms? The problem is server response time, not the page itself. Fix hosting, caching, or CDN first.
- Is the LCP element an image? Check whether it is in the initial HTML or injected by JavaScript. JS-injected images are not discoverable by the preload scanner and will always load late.
- Are there long tasks blocking the main thread? Look for red bars in the Lighthouse “Avoid long main-thread tasks” audit.
- Are layout shifts happening after fonts load or after an ad/embed appears? Those are your CLS sources.
How to diagnose and fix LCP, INP, and CLS
LCP fixes, prioritized by impact
1. Improve TTFB with caching and a CDN. Server response time is the floor beneath every other metric. If your Time to First Byte is above 600ms, no amount of image optimization will get you to a good LCP. Enable full-page caching (Redis, Varnish, or your CMS’s built-in cache) and put a CDN in front of your origin. For UK sites, choose a CDN with edge nodes in London and Manchester — Cloudflare, Fastly, and AWS CloudFront all have strong UK presence. Infrastructure and caching improvements can reduce LCP via TTFB by 200–800ms.

2. Make the LCP resource discoverable. If your LCP image is set as a CSS background or loaded via JavaScript, the browser’s preload scanner cannot find it in the initial HTML. Move it to an <img> tag in the HTML source, or add a <link rel="preload"> tag in the <head>.
<link rel="preload" as="image" href="/hero.webp" fetchpriority="high">
3. Add fetchpriority="high" to the LCP image. This signals to the browser to prioritize this resource over other images. Combined with preloading, this fix alone can improve LCP by 500–1,500ms according to remediation data.
4. Use modern image formats and correct sizing. Serve WebP or AVIF instead of JPEG/PNG. Serve images at the display size, not larger. Use srcset and sizes attributes so mobile devices download smaller files.
5. Never lazy-load the LCP element. loading="lazy" on the LCP image delays its fetch until the browser has painted the viewport, which directly inflates LCP. Remove it from the hero image.
INP fixes, prioritized by impact
INP now covers the entire session, not just the first interaction. That means a slow click handler on a filter dropdown or a laggy form submission can push your INP into “Poor” territory even if the initial page load is fast.
1. Break up long tasks. Any JavaScript task running longer than 50ms on the main thread blocks the browser from responding to user input. Use scheduler.yield() (with a setTimeout fallback for broader browser support) to yield control back to the browser between chunks of work.
2. Defer non-critical JavaScript. Scripts that are not needed for the initial interaction should load with defer or type="module". Move analytics, chat widgets, and marketing tags to load after the first user interaction where possible.
3. Reduce event handler complexity. Audit your click and input handlers. Handlers that trigger synchronous DOM reads followed by writes cause forced reflows. Batch DOM reads separately from DOM writes.
4. Audit and throttle third-party scripts. Tag managers, A/B testing tools, and ad scripts are frequent INP offenders. Use Chrome DevTools’ Performance panel to identify which third-party scripts are running long tasks during interactions. Consider loading them conditionally or replacing client-side tags with server-side tracking to reduce main-thread pressure.
5. Reduce DOM size. A DOM with more than 1,400 nodes slows style recalculation and layout, which adds latency to every interaction. Virtualize long lists and paginate large data sets.
CLS fixes, prioritized by impact
1. Add explicit width and height attributes to all images and video elements. This is the single highest-impact CLS fix for most sites. Without these attributes, the browser cannot reserve space before the image loads, so content shifts down when it arrives. Adding dimensions can reduce CLS by 0.05–0.3 points per remediation benchmarks.
<img src="/hero.webp" width="1200" height="630" alt="Hero image">
2. Reserve space for dynamic content. Ads, embeds, and cookie banners that inject above existing content are major CLS sources. Use CSS min-height or aspect-ratio containers to hold space before the content loads.
3. Use font-display: optional or font-display: swap carefully. Fonts that load late and swap out cause text to reflow. font-display: optional prevents the swap entirely by only using the web font if it is already cached. font-display: swap is more permissive but can cause visible shifts. Preloading the font file is the cleanest solution.
4. Avoid CSS animations that trigger layout. Animating top, left, width, or height forces the browser to recalculate layout on every frame. Use transform and opacity instead — they run on the compositor thread and do not cause layout shifts.
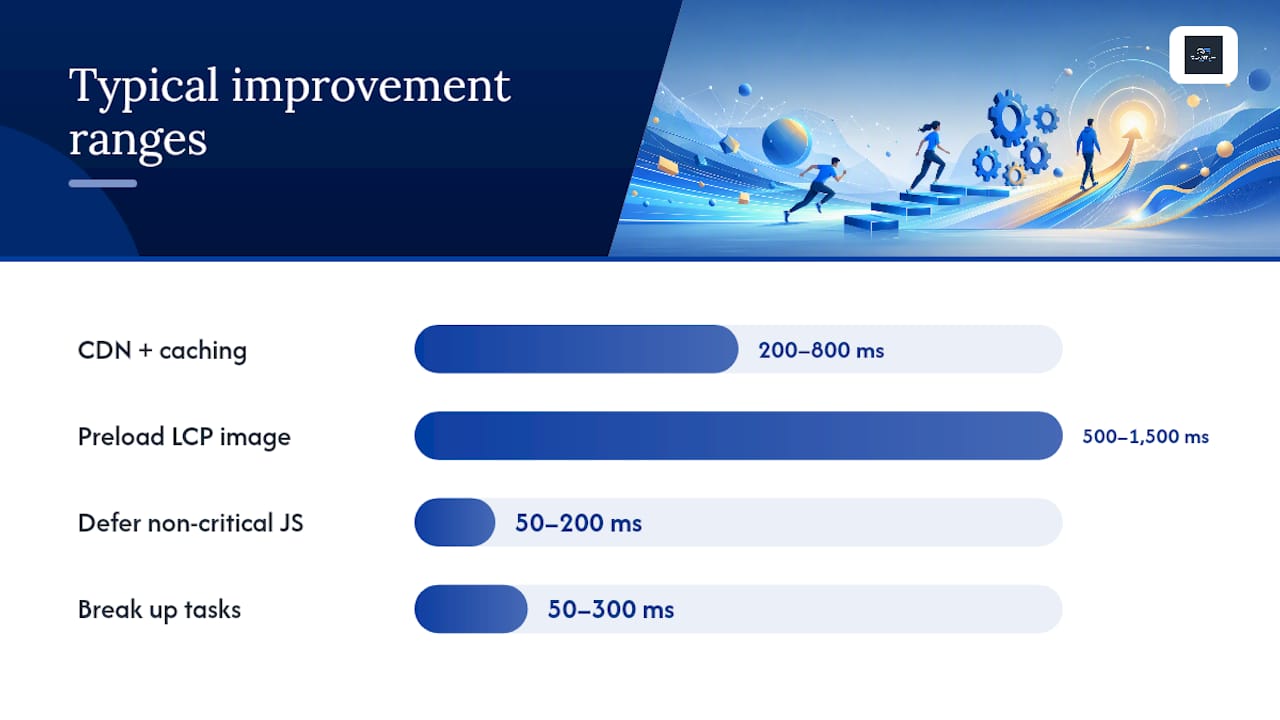
Typical impact ranges for common fixes
| Fix | Metric | Typical improvement |
|---|---|---|
| Add CDN + page caching | LCP (via TTFB) | 200–800ms |
| Preload + fetchpriority on LCP image | LCP | 500–1,500ms |
| Add image width/height attributes | CLS | 0.05–0.3 points |
| Defer non-critical JS | INP | 50–200ms |
| Break up long tasks (yield) | INP | 50–300ms |
Pro Tip: After deploying a fix, use the web-vitals JS library to capture RUM data immediately. CrUX and Search Console update on a 28-day rolling window, so RUM is the only way to confirm a fix is working before your next sprint review.
A prioritized checklist you can act on today
The step-by-step remediation workflow follows a clear sequence: assess, prioritize, fix, verify. Here is how that maps to your actual sprint calendar.
Today (1–4 hours):
- Run Search Console Core Web Vitals report and note the worst URL group and metric.
- Paste the worst-performing URL into PageSpeed Insights and identify the LCP element.
- Remove
loading="lazy"from the LCP image. - Add
widthandheightattributes to all images missing them. - Add
fetchpriority="high"to the LCP image tag.
This week (1–2 sprints):
- Enable full-page caching on your server or CMS.
- Add a CDN with UK edge presence in front of your origin.
- Audit scripts loading in
<head>and move non-critical ones todeferor end-of-body. - Identify the top three long tasks in Chrome DevTools Performance panel and plan task-splitting.
Next sprint / backlog:
- Audit all third-party scripts via the Network panel and remove or defer those with no measurable business value.
- Implement the web-vitals JS library for ongoing RUM.
- Refactor the heaviest interaction handlers identified in INP profiling.
- Evaluate server-side rendering or static generation for high-traffic templates.
Where to focus for the biggest business impact
The highest-leverage changes are rarely the most technically interesting ones. Performance experts consistently point to infrastructure and third-party script management as the areas that produce the largest, most reliable gains — often without touching a single line of application code.
For UK sites specifically, the choice of hosting and CDN matters more than most developers expect. A server hosted in a US data center with no UK edge node will have a structural TTFB disadvantage for British users that no amount of JavaScript optimization can overcome. Target TTFB below 200ms for cached responses and below 400ms for uncached ones. That range is a practical SLO (Service Level Objective) you can set with your hosting provider and verify with PageSpeed Insights.
Third-party scripts deserve their own audit. Tag managers, live chat tools, A/B testing platforms, and affiliate tracking pixels all run on the main thread and compete with your own code for execution time. A single poorly configured tag manager can add 300–500ms to INP on a mid-range Android device. The fix is not always removal — it is control. Load scripts conditionally, cap their execution budget, and consider moving analytics collection to server-side tracking to reduce client-side load entirely.
For e-commerce sites, the business case is direct. Conversion rate improvements from faster page loads are well-documented across the industry, and the pages that matter most — homepage, product pages, checkout — are exactly the ones where CWV failures tend to concentrate. Prioritize those templates over individual URLs. Fixing one template can move hundreds of URL groups from “Poor” to “Good” in a single sprint.
- Focus infrastructure investment on your highest-traffic landing pages first.
- Set explicit SLOs: LCP p75 ≤ 2.5s and TTFB < 400ms for key templates.
- Audit third-party scripts quarterly and assign each one a business owner who can justify its presence.
- Link user journey mapping to your CWV priority list so technical fixes align with the pages that drive revenue.
- For 3D product viewers and rich media embeds, lazy-load them below the fold and reserve their container dimensions to prevent CLS. Partners like Hangr’s 3D product viewers can be integrated without CWV penalties when implemented with proper dimension reservations and deferred loading.
Essential tools and resources for measuring and monitoring
Keeping Core Web Vitals in the “Good” range after launch requires ongoing monitoring, not a one-time audit. These are the tools worth building into your workflow.
Official documentation and field data:
- web.dev Core Web Vitals guides — the authoritative source for metric definitions, thresholds, and remediation patterns.
- Google Search Central Core Web Vitals — explains how CWV affect search ranking and links to all Google tooling.
- CrUX API — query origin- and URL-level field data programmatically; useful for building custom dashboards or monitoring multiple properties.
Testing and debugging tools:
- PageSpeed Insights — combined field + lab report per URL; the fastest way to diagnose a single failing page.
- Lighthouse CLI — run audits in CI/CD pipelines to catch regressions before deployment.
- Chrome DevTools Performance panel — frame-by-frame analysis of long tasks, layout shifts, and interaction latency.
RUM and monitoring:
- web-vitals JS library — the reference implementation for collecting LCP, INP, and CLS from real users. Matches Google’s exact metric semantics.
- For UK sites, prefer RUM providers with GDPR-compliant data processing agreements and EU/UK data residency options. Self-hosted solutions (sending web-vitals data to your own analytics endpoint) avoid third-party data sharing entirely and reduce the script load that RUM tools themselves can introduce.
Ongoing maintenance:
A structured website maintenance plan should include monthly CWV checks in Search Console, quarterly third-party script audits, and a regression alert when any URL group drops from “Good” to “Needs Improvement.” Catching a regression early — before it accumulates 28 days of bad CrUX data — is far cheaper than remediating it after the fact.
What actually moves the needle on Core Web Vitals
Most teams spend their first sprint optimizing JavaScript bundle sizes and then wonder why their Search Console scores barely moved. The reason is almost always infrastructure. A 400ms TTFB means LCP cannot physically reach 2.5s on a slow mobile connection, regardless of how lean your bundles are. Fix the server first.
The second mistake is treating Core Web Vitals as a one-time project. CrUX data is a 28-day rolling window, which means a single bad deployment can drag your scores down for nearly a month. Teams that ship fast and deploy often need RUM in place before they need anything else — it is the only way to catch a regression the same day it happens rather than four weeks later.
There is also a genuine trade-off worth naming: chasing a perfect CLS score on a page with a live chat widget, a cookie banner, and a personalized hero image is a diminishing-returns exercise. At some point, “Needs Improvement” on CLS with a score of 0.12 is an acceptable business decision if the alternative is removing features that drive conversions. The goal is not a perfect score — it is a score that does not cost you ranking or users. Know where that line is for your site and communicate it clearly to stakeholders.
One workflow change that consistently speeds delivery: fix templates, not individual pages. A product page template used by 800 URLs is worth 800 times more than a single URL fix. When writing dev tickets, always include the metric name, the current p75 value from Search Console, the target p75, a PageSpeed Insights screenshot of the diagnostic, and the specific element or script causing the issue. A ticket that says “improve LCP” is not actionable. A ticket that says “LCP element is /hero.jpg, current p75 is 4.1s on mobile, target is ≤ 2.5s, root cause is missing fetchpriority and no CDN caching” gets fixed in the next sprint.
Quantum3 can audit and fix your Core Web Vitals
Scoring well on web performance metrics requires more than reading a guide — it requires someone who can read your specific data, identify the highest-impact fixes, and implement them without breaking what already works. Quantum3 delivers exactly that: a structured Core Web Vitals audit that maps your Search Console URL groups to prioritized sprint tickets, with expected impact ranges and a clear verification timeline.

The audit covers TTFB and hosting assessment, LCP element identification, INP profiling across key user flows, CLS root-cause analysis, and a third-party script inventory. You receive a prioritized remediation list with realistic timelines, plus RUM setup so you can validate every fix immediately rather than waiting on CrUX. For UK businesses, Quantum3 also advises on CDN configuration and GDPR-compliant monitoring options. If you need ongoing support after the initial sprint, a retainer covers monthly checks, regression alerts, and continuous optimization as your site evolves.
Ready to move your site from “Poor” to “Good” in a single sprint? View Quantum3’s services or send an enquiry to get a scoped audit started.
Sources
- Web
- Core Web Vitals - Google Search Central
- Core Web Vitals report - Search Console Help
- How to Pass Core Web Vitals: Step by Step (2026)
Recommended
Want this for your business?
Tell us what you have in mind. A quick conversation is all it takes to scope it out.