Insights
A/B Testing Landing Pages: A Practitioner’s Guide

Run a valid A/B test on a landing page by forming one clear hypothesis, mapping it to a single primary metric, and collecting enough traffic before you read the results. That last part is where most tests fail. Before you launch anything, run through this checklist:
- Define one hypothesis using the format: “We believe changing [element] from [A] to [B] will increase [metric] by [X] because [reason].”
- Pick one primary metric (conversion rate, cost per acquisition, or revenue per visitor) and one or two secondary metrics.
- Calculate your required sample size using baseline conversion rate, minimum detectable effect (MDE), and a confidence level of 95%.
- Set a minimum run time of at least two full business cycles before reviewing results.
- QA every variant across browsers, devices, and tracking tags before traffic goes live.
- Document everything: what changed, when, and why.
Key Takeaways
A/B testing landing pages produces reliable results only when you commit to a single hypothesis, calculate sample size before launch, and refuse to read results until both time and traffic thresholds are met.
| Point | Details |
|---|---|
| One hypothesis per test | Map every test to one primary metric; secondary metrics are sanity checks, not decision drivers. |
| Calculate sample size first | Use baseline conversion rate, MDE, and 95% confidence to compute required visitors per variant before launch. |
| Minimum two business cycles | Run for at least two full weeks to account for day-of-week variation before reading results. |
| Test headline before CTA | Follow the hierarchy: headline, then CTA, then social proof, then form friction, in that order. |
| Quantum3 for managed testing | Quantum3 handles variant builds, analytics wiring, and post-rollout monitoring for teams that want a done-for-you approach. |
Table of Contents
- What is A/B testing on landing pages?
- When should you use A/B testing versus multivariate testing?
- How do you plan a landing page test properly?
- How do you design clean test variants?
- Which tools and implementation patterns work best?
- How long should you run a landing page test?
- How do you analyze A/B test results correctly?
- What happens after you find a winning variant?
- A real-world landing page testing workflow
- What the data consistently shows about landing page tests
- Quantum3 can build, test, and roll out your landing pages
- Sources
What is A/B testing on landing pages?
A/B testing, also called split testing, is a controlled experiment that sends roughly half your traffic to a control page (version A) and the other half to a variant (version B). You change one element or one coherent set of changes, measure which version produces more of your target outcome, and declare a winner only when the result clears a pre-specified confidence threshold.
The term “split testing” is a direct synonym. Both refer to the same methodology. The distinction worth knowing is between A/B testing and multivariate testing (MVT). In an A/B test, you compare two versions of a page. In MVT, you test multiple elements simultaneously across many combinations, for example, three headlines crossed with two hero images crossed with two CTA labels, producing twelve combinations at once.
Typical A/B test use cases for landing pages include:
- Headline copy or value proposition wording
- CTA button text, color, or placement
- Hero image or video versus a static graphic
- Form length (five fields versus two fields)
- Social proof placement (above or below the fold)
MVT is appropriate when you need to understand interaction effects between elements and when you have enough traffic to reach significance across all combinations. For most landing pages, A/B testing is the right starting point.
Message match deserves a quick note here. Your variant must maintain the same promise your ad or email made. A headline test that drifts away from the source message will depress conversions regardless of copy quality, and the test result will reflect the mismatch, not the headline itself. Reviewing user journey mapping before writing variants helps you keep that alignment tight.
When should you use A/B testing versus multivariate testing?
Pick A/B testing when your traffic is low to moderate and your goal is to isolate the impact of one change. Pick MVT only when you have substantially higher traffic and a genuine reason to understand how multiple elements interact.
The four inputs that determine your required sample size are:
- Baseline conversion rate: your current page’s conversion rate before the test.
- Minimum detectable effect (MDE): the smallest lift you care about detecting (e.g., a 10% relative improvement on a 3% baseline).
- Confidence level: typically 95%, meaning a 5% false-positive rate.
- Statistical power: typically 80%, meaning an 80% chance of detecting a real effect if one exists.
Evan Miller’s sample-size calculator takes these four inputs and returns the required visitors per variant. Use it before you start, not after.
| Baseline Conversion Rate | MDE (Relative) | Visitors Needed Per Variant | Recommended Run Time |
|---|---|---|---|
| 1% | 20% | ~19,000 | 4–6 weeks |
| 3% | 15% | ~8,500 | 3–4 weeks |
| 5% | 10% | ~15,000 | 3–5 weeks |
| 10% | 10% | ~7,500 | 2–4 weeks |
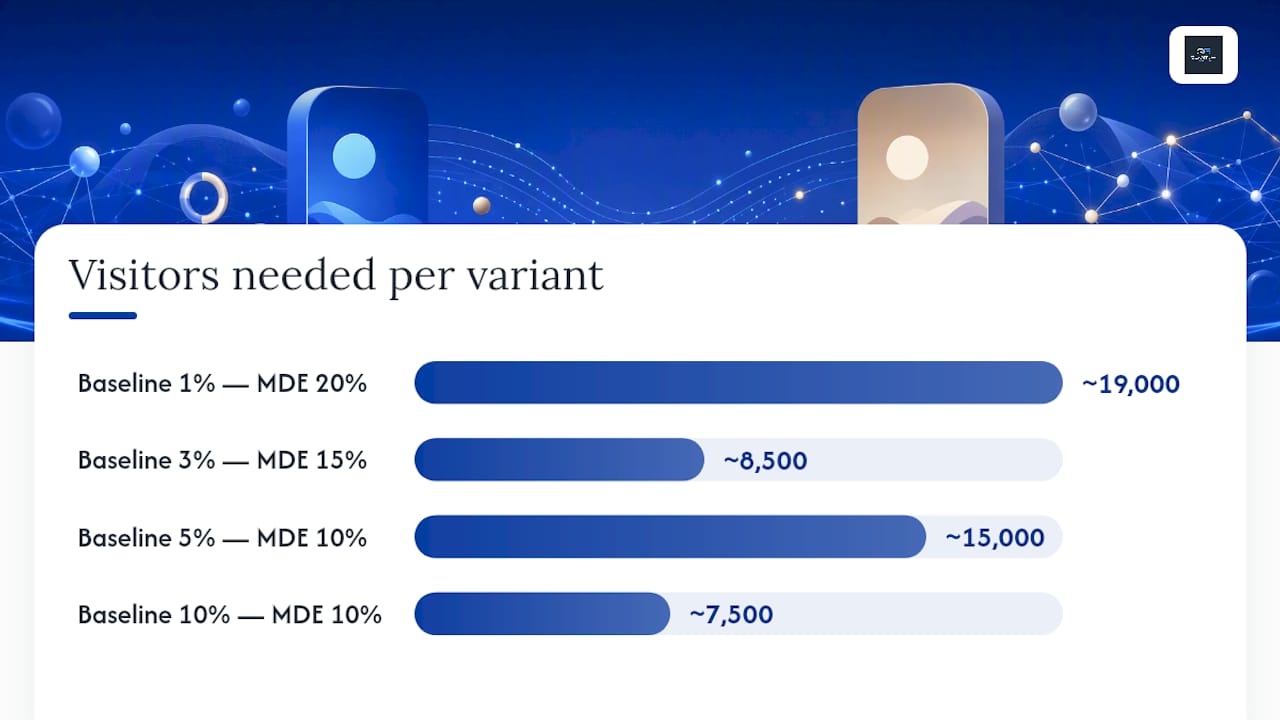
Use Evan Miller’s calculator for your exact inputs.*
A few practical rules:
- If your page receives fewer than a typical threshold of visitors per month, skip inferential A/B testing. Run qualitative research such as user interviews, session recordings, or heatmaps instead and use those findings to make a direct change.
- MVT requires roughly the same per-variant sample as A/B testing, multiplied by the number of combinations. Twelve combinations at 8,500 visitors each means over 100,000 visitors needed. Most landing pages cannot support that.
- Directional testing (looking at trends without claiming statistical significance) is a legitimate fallback for low-traffic pages, provided you document its limitations and do not treat the result as conclusive.
How do you plan a landing page test properly?
Every test must map a single hypothesis to one primary metric and one or two secondary metrics. That constraint is not bureaucratic. It is what makes the result interpretable.
Use this hypothesis template every time: “We believe changing [element] from [A] to [B] will increase [metric] by [X] because [reason].” The “because” clause is the part most teams skip, and it is the part that tells you whether the test is worth running. A hypothesis without a reason is a guess dressed up as an experiment.
Primary KPI options for landing pages:
- Conversion rate (form submissions, purchases, sign-ups)
- Cost per acquisition (when paid traffic feeds the test)
- Revenue per visitor (for e-commerce or high-ticket offers)
Prelaunch tracking checklist:
- Confirm the conversion event fires correctly in your analytics platform for both variants.
- Check for deduplication: does a user who submits the form twice count as one conversion or two?
- Verify cross-domain tracking if your form or checkout lives on a subdomain or third-party platform.
- Validate that the analytics goal or event is mapped to the correct variant identifier.
- Run a smoke test: submit a test form on each variant and confirm the event appears in your dashboard.
Pro Tip: Before writing a single variant, spend 20 minutes in session recordings and heatmaps. Scroll maps show where users stop reading; click maps show where they expect a link that does not exist. Both are faster at surfacing test ideas than any best-practices list.
Leadpages’ testing plan guidance reinforces this: tests without hypotheses waste time. The hypothesis forces you to articulate why a change should work, which also tells you what secondary metric to watch as a sanity check.
How do you design clean test variants?
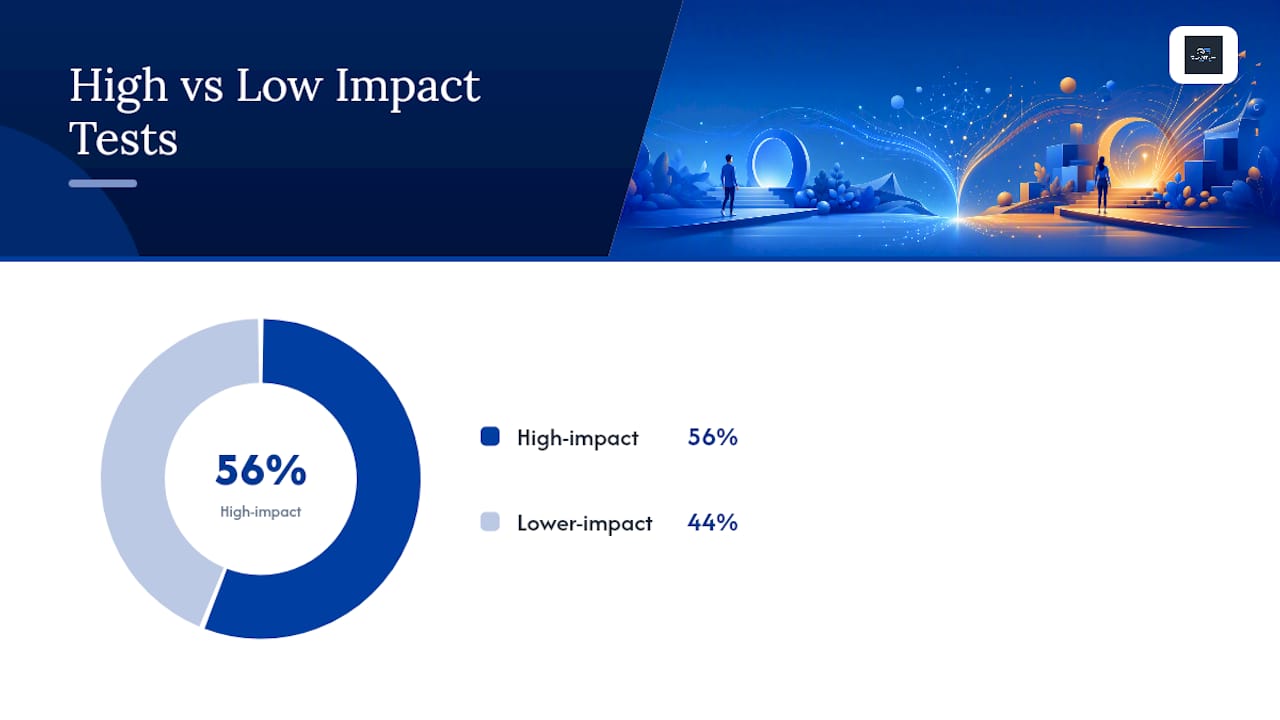
Start with the highest-leverage element that aligns with your hypothesis. PulseCRO’s landing page testing guide recommends a clear testing hierarchy: headline first, then CTA, then social proof, then form friction. That order reflects where most conversion losses occur.
High-impact elements to test first:
- Headline and subheadline (value proposition clarity)
- CTA button text and placement
- Offer framing (free trial vs. no credit card required vs. get started today)
- Hero image or video (product-in-use vs. lifestyle vs. abstract)
- Form length and field labels
Lower-impact items to postpone:
- Footer layout
- Font choices within the same type family
- Color changes that do not affect CTA contrast
- Micro-copy in non-critical areas
Variant design checklist:
- Change only what your hypothesis specifies. Every additional change you make is a variable you cannot explain later.
- Document every difference between control and variant in a shared log before launch.
- Keep visual design consistent across variants except for the tested element.
- Do not run a second test on the same page while this one is live.
QA items before going live:
- Render each variant in Chrome, Safari, Firefox, and Edge on both desktop and mobile.
- Confirm tracking tags fire on page load and on conversion for each variant.
- Submit a test form on each variant and verify the confirmation state and CRM entry.
- Check page speed for each variant. A variant that loads 1.5 seconds slower than the control will lose for reasons unrelated to your hypothesis.
Unbounce’s landing page testing guide and Contentful’s A/B testing guide both flag form length and CTA placement as consistently high-impact test candidates, which aligns with what practitioners see across lead-gen and e-commerce pages.
Which tools and implementation patterns work best?
Use platform-native A/B testing when your landing page lives inside a page builder that supports it. Use tag-based or server-side solutions when you need cross-domain measurement, stable user assignment, or tighter control over the split.
Tool categories and their trade-offs:
- Page-builder native tests (built into landing-page platforms): easiest to set up, limited to pages within that platform, and measurement is often siloed from your main analytics stack. Good for simple, self-contained tests.
- Client-side A/B libraries (JavaScript-based): flexible, works across most stacks, but introduces flicker risk if the variant loads after the control. Requires careful implementation to avoid layout shift.
- Server-side experiments: the variant is assigned before the page renders, eliminating flicker entirely. Requires developer involvement but produces the cleanest measurement. Relevant when your page is part of a complex funnel or when you need cross-device consistency.
- GA4 experiments: Google Analytics 4 supports redirect-based A/B tests natively. Emilytics’ GA4 testing guide walks through the setup and recommends a minimum run of 2–4 weeks and a p-value below 0.05 for declaring a winner.
- Dedicated CRO platforms: offer advanced segmentation, multi-page funnel tests, and integrated heatmaps. Appropriate for teams running tests at scale.
For teams evaluating server-side tracking as part of their measurement stack, the same principles apply to experiment assignment: server-side splits are more reliable when cross-domain or cross-device consistency matters.
Implementation patterns:
- Same-URL variant swaps: JavaScript rewrites the page in-browser. Simple but carries flicker risk.
- Separate-URL splits: traffic is routed to two distinct URLs. Easier to QA, but requires canonical tag management to avoid SEO issues.
- Server-side user assignment: the server decides which variant to serve before the response is sent. No flicker, full control, requires engineering resources.
Practical QA steps after implementation:
- Verify the traffic split is actually 50/50 (or your chosen ratio) in your analytics platform after 24 hours.
- Check that both variants are firing conversion events independently.
- Confirm no variant is leaking into the other’s session data.
Privacy and consent matter here. If you operate under CCPA or serve users subject to GDPR, your A/B testing tool must respect consent signals. Do not assign users to variants or track conversion events before consent is granted where required by law.
How long should you run a landing page test?
Set your minimum run time and minimum sample size before you launch, and do not check results until both thresholds are met. Peeking at results early and stopping when you see a promising lift is the single most common way to produce a false positive.
Stopping rules:
- Run for at least two full business cycles (typically two weeks minimum) to account for day-of-week variation.
- Reach the pre-calculated sample size per variant before reading results.
- Declare a winner only when the primary metric clears your pre-specified confidence level (95% is standard).
- If the test runs past four weeks without reaching significance, evaluate whether the MDE was realistic or whether the page simply does not have enough traffic.
Monitoring checklist while the test runs:
- Check for traffic anomalies: a sudden spike from a press mention or a paid campaign change can skew results.
- Watch for bot traffic inflating session counts without real conversions.
- Note any seasonality events (holidays, product launches, industry events) that fall within the test window.
- Confirm no cross-variant leakage: a user who sees both variants contaminates both data sets.
What to avoid:
- Peeking at results daily and making decisions based on early data.
- Making any changes to either variant after the test starts.
- Running overlapping tests on the same page simultaneously.
- Launching a test during a known atypical traffic period (Black Friday, a product launch week, a major ad spend change).
Pro Tip: Set automated alerts in your analytics platform for page-speed regressions and conversion-event failures. A broken form or a slow variant can run for days before anyone notices, and the contaminated data is unrecoverable.
How do you analyze A/B test results correctly?
Declare a winner only when the pre-specified primary metric reaches your chosen confidence level and secondary checks pass. Statistical significance on the primary metric is necessary but not sufficient.
Harvard Business Review’s analysis of online experiments makes the point directly: disciplined experimental design is what separates experiments that produce real business lift from those that produce false positives. Weak design inflates the apparent win rate.
Common analysis mistakes:
- Stopping early: a result that looks significant at day three often reverts by day fourteen.
- Ignoring segments: a variant that wins overall may lose on mobile or among returning visitors. Check device-level and traffic-source splits before rolling out.
- Multiple comparisons: testing ten metrics and declaring a win on whichever one crosses 95% confidence inflates your false-positive rate substantially. Pre-specify your primary metric.
- Confusing statistical significance with business significance: a 0.2% absolute lift on a 2% baseline is statistically significant with enough traffic, but it may not justify the engineering cost of a rollout.
Example interpretation walkthrough:
Before declaring a winner:
- Check the primary metric: 95% confidence reached. ✓
- Check secondary metrics: revenue per visitor and lead quality score are flat or positive. ✓
- Check device split: desktop shows +15% lift, mobile shows +2% (not significant). Note this for the rollout.
- Check the sample size against your pre-calculation. ✓
- Check for any external events during the test window that could explain the lift.
For binary conversion outcomes, a chi-squared test is one appropriate statistical method. Most A/B testing platforms run this automatically, but knowing what the platform is computing helps you interpret edge cases.
For inconclusive tests:
- If you reached sample size but did not reach significance, the effect is likely smaller than your MDE. Either accept no meaningful difference or re-run with a larger sample targeting a smaller MDE.
- If you did not reach sample size within your run window, the page lacks sufficient traffic for this test. Consider a qualitative approach or a larger change that produces a bigger effect.
What happens after you find a winning variant?
Rollout checklist:
- Redirect or replace the control with the winning variant.
- Keep the original tracking in place for the validation period to confirm the lift holds at full traffic.
- Document the test: hypothesis, variant description, result, confidence level, and the date of rollout.
- Share the result with the team and note any segment-level nuances (e.g., the lift was stronger on desktop).
Sequencing future tests:
- Review your test backlog and score each candidate by estimated impact and implementation effort.
- Prioritize tests that address the highest-friction point in the current funnel.
- Root each new hypothesis in data: session recordings, heatmaps, user feedback, or downstream metrics like lead quality and retention.
- Schedule one test per page at a time. Overlapping tests on the same page produce uninterpretable results.
After rollout, monitor secondary KPIs for at least 30 days. A headline change that lifts form submissions may reduce lead quality if it attracts a different audience segment. Revenue per visitor and downstream retention metrics tell you whether the win is real or just a volume increase.
For e-commerce conversion optimization, the same sequencing logic applies: test the offer and headline first, then work down to CTA and form friction once the top of the page is validated.
A real-world landing page testing workflow
A practical testing workflow follows five stages: diagnose, hypothesize, build, run, and analyze. Here is how that looks in practice for a lead-gen landing page.
Stage-by-stage metrics:
- Diagnose: review heatmaps and session recordings to identify where users drop off. Track scroll depth, click-through rate on the CTA, and form start rate.
- Hypothesize: form a specific hypothesis based on the diagnostic data. Example: users are clicking the CTA but abandoning the form at field three, suggesting field count is the friction point.
- Build: create a variant with a shorter form (two fields instead of five). Document every difference. QA across devices.
- Run: set a minimum of two weeks and the pre-calculated sample size. Monitor for anomalies.
- Analyze: measure form completion rate (primary), cost per lead (secondary), and lead quality score (secondary). Check device splits.
Sample test sequence for a lead-gen page:
- Test 1: Headline and value proposition. This is the highest-leverage element. A headline that does not match the ad’s promise loses visitors before they read anything else.
- Test 2: CTA text and placement. Once the headline is validated, test whether “Get a Free Quote” outperforms “See Pricing” for your audience.
- Test 3: Form length. After CTA is validated, test reducing fields. Measure both form completion rate and lead quality.
- Test 4: Social proof format. Test a testimonial with a photo and name against a logo strip of client brands.
Client objectives shape how you define success at each stage. A client prioritizing lead volume sets a lower quality threshold and optimizes for form completion rate. A client prioritizing lead quality weights revenue per visitor and downstream close rate more heavily. Both are valid, but they require different primary metrics and different success thresholds.
For service businesses, web design principles for lead generation reinforce the same hierarchy: message clarity and CTA prominence consistently outperform layout and color changes in controlled tests.
What the data consistently shows about landing page tests
The conventional wisdom in conversion optimization is that you should test everything. That is technically true but practically useless. The more useful insight is that most pages have one or two high-leverage problems, and the rest of the page is fine. Testing everything in sequence wastes months on changes that will never move the needle.
What actually drives results in landing-page testing is message match and offer clarity, not button colors. A headline that directly mirrors the ad’s promise, and a CTA that names the specific outcome the visitor gets, will outperform a generic “Submit” button in a different shade of blue almost every time. The teams that run the most tests are not always the teams that improve the most. The teams that improve the most are the ones that diagnose before they test.
There is also an ethical dimension that practitioners often skip. When you run an A/B test, real users are seeing different experiences without their explicit knowledge. That is generally acceptable under standard industry practice, but it requires that both variants provide a genuinely usable experience. A variant that deliberately degrades UX to make the control look better, or that tests manipulative dark patterns, crosses a line. Consent requirements under CCPA and GDPR also apply to the tracking that underlies your test. If a user has not consented to analytics tracking, they should not be included in your experiment data.
Mobile-first QA is another area where teams consistently underinvest. A variant that looks clean on a 1440px desktop monitor may have a broken CTA or an overlapping form label on a 390px iPhone screen. Run your QA on real devices, not just browser emulators, before you send traffic.
Quantum3 can build, test, and roll out your landing pages
Running a valid landing page experiment requires more than a hypothesis and a testing tool. It requires clean variant builds, correctly wired analytics, a reliable traffic split, and a rollout process that preserves the lift you measured. That is exactly what Quantum3 delivers.

Quantum3’s landing page and funnel development service covers the full experiment lifecycle: variant design and build, analytics instrumentation, split implementation (including server-side when your funnel requires it), and post-rollout monitoring to confirm the lift holds. You get real-time analytics dashboards so you can see conversion data as it accumulates, without waiting for a weekly report. For teams that want to layer in personalization or advanced traffic routing alongside testing, Quantum3’s AI integrations service connects those capabilities directly to your existing stack. To get started, visit the Quantum3 enquiries page and describe your current page and testing goals.
Sources
- Sample size and A/B testing methodology — Evan Miller
- The surprising power of online experiments — Harvard Business Review
- Landing Page A/B Testing in 2026: What to Test, in What Order | PulseCRO
- Landing page A/B testing – expert tips, tools and examples to get the best results — Unbounce
Recommended
Want this for your business?
Tell us what you have in mind. A quick conversation is all it takes to scope it out.